Quantum Trajectories for Many-atom CQED
Atom-cavity systems have been proposed to study the differences between classical and quantum phenomena, and to manipulate atomic states important for quantum information systems. Although experiments have been performed with many atoms in cavity quantum electrodynamics (CQED), robust theoretical modeling have not been attempted to date particularly away from the weak driving field limit. Second-order correlation measurements (SCMs) commonly used in CQED to reveal the characteristic decay times, effective atomic numbers and nonclassical photon correlations (the signature of quantum field effects). Second-order correlations functions (SCFs) derived in this weak-field limit are typically used to describe these measurements. We have studied the limitations of these functions using a rigorous theoretical modeling based on a quantum trajectory treatment. Particular attention has been paid to the effects of atomic motion for both standing and travelling wave cavities. It was demonstrated that the SCMs are sensitive to atomic beam fluctuation. Away from the weak driving field limit, spontaneous emission reduces the signature of SCMs. To study this regime, we have developed approximate quantum trajectory method to probe the system on resonance, and performed full simulations to account for tilts of the atomic beam.
- L.-M. Duan and H. J. Kimble, Physical Review Letters, 92, 127902 (2004).
- G. T. Foster, S. L. Mielke and L. A. Orozco, Physical Review A, 61, 053821 (2000).
- S. L. Mielke, G. T. Foster and L. A. Orozco, Physical Review Letters, 80, 3948 (1998).
- G. Rempe, R. J. Thompson, R. J. Brecha, W. D. Lee and H. J. Kimble, Physical Review Letters, 67, 1727 (1991)
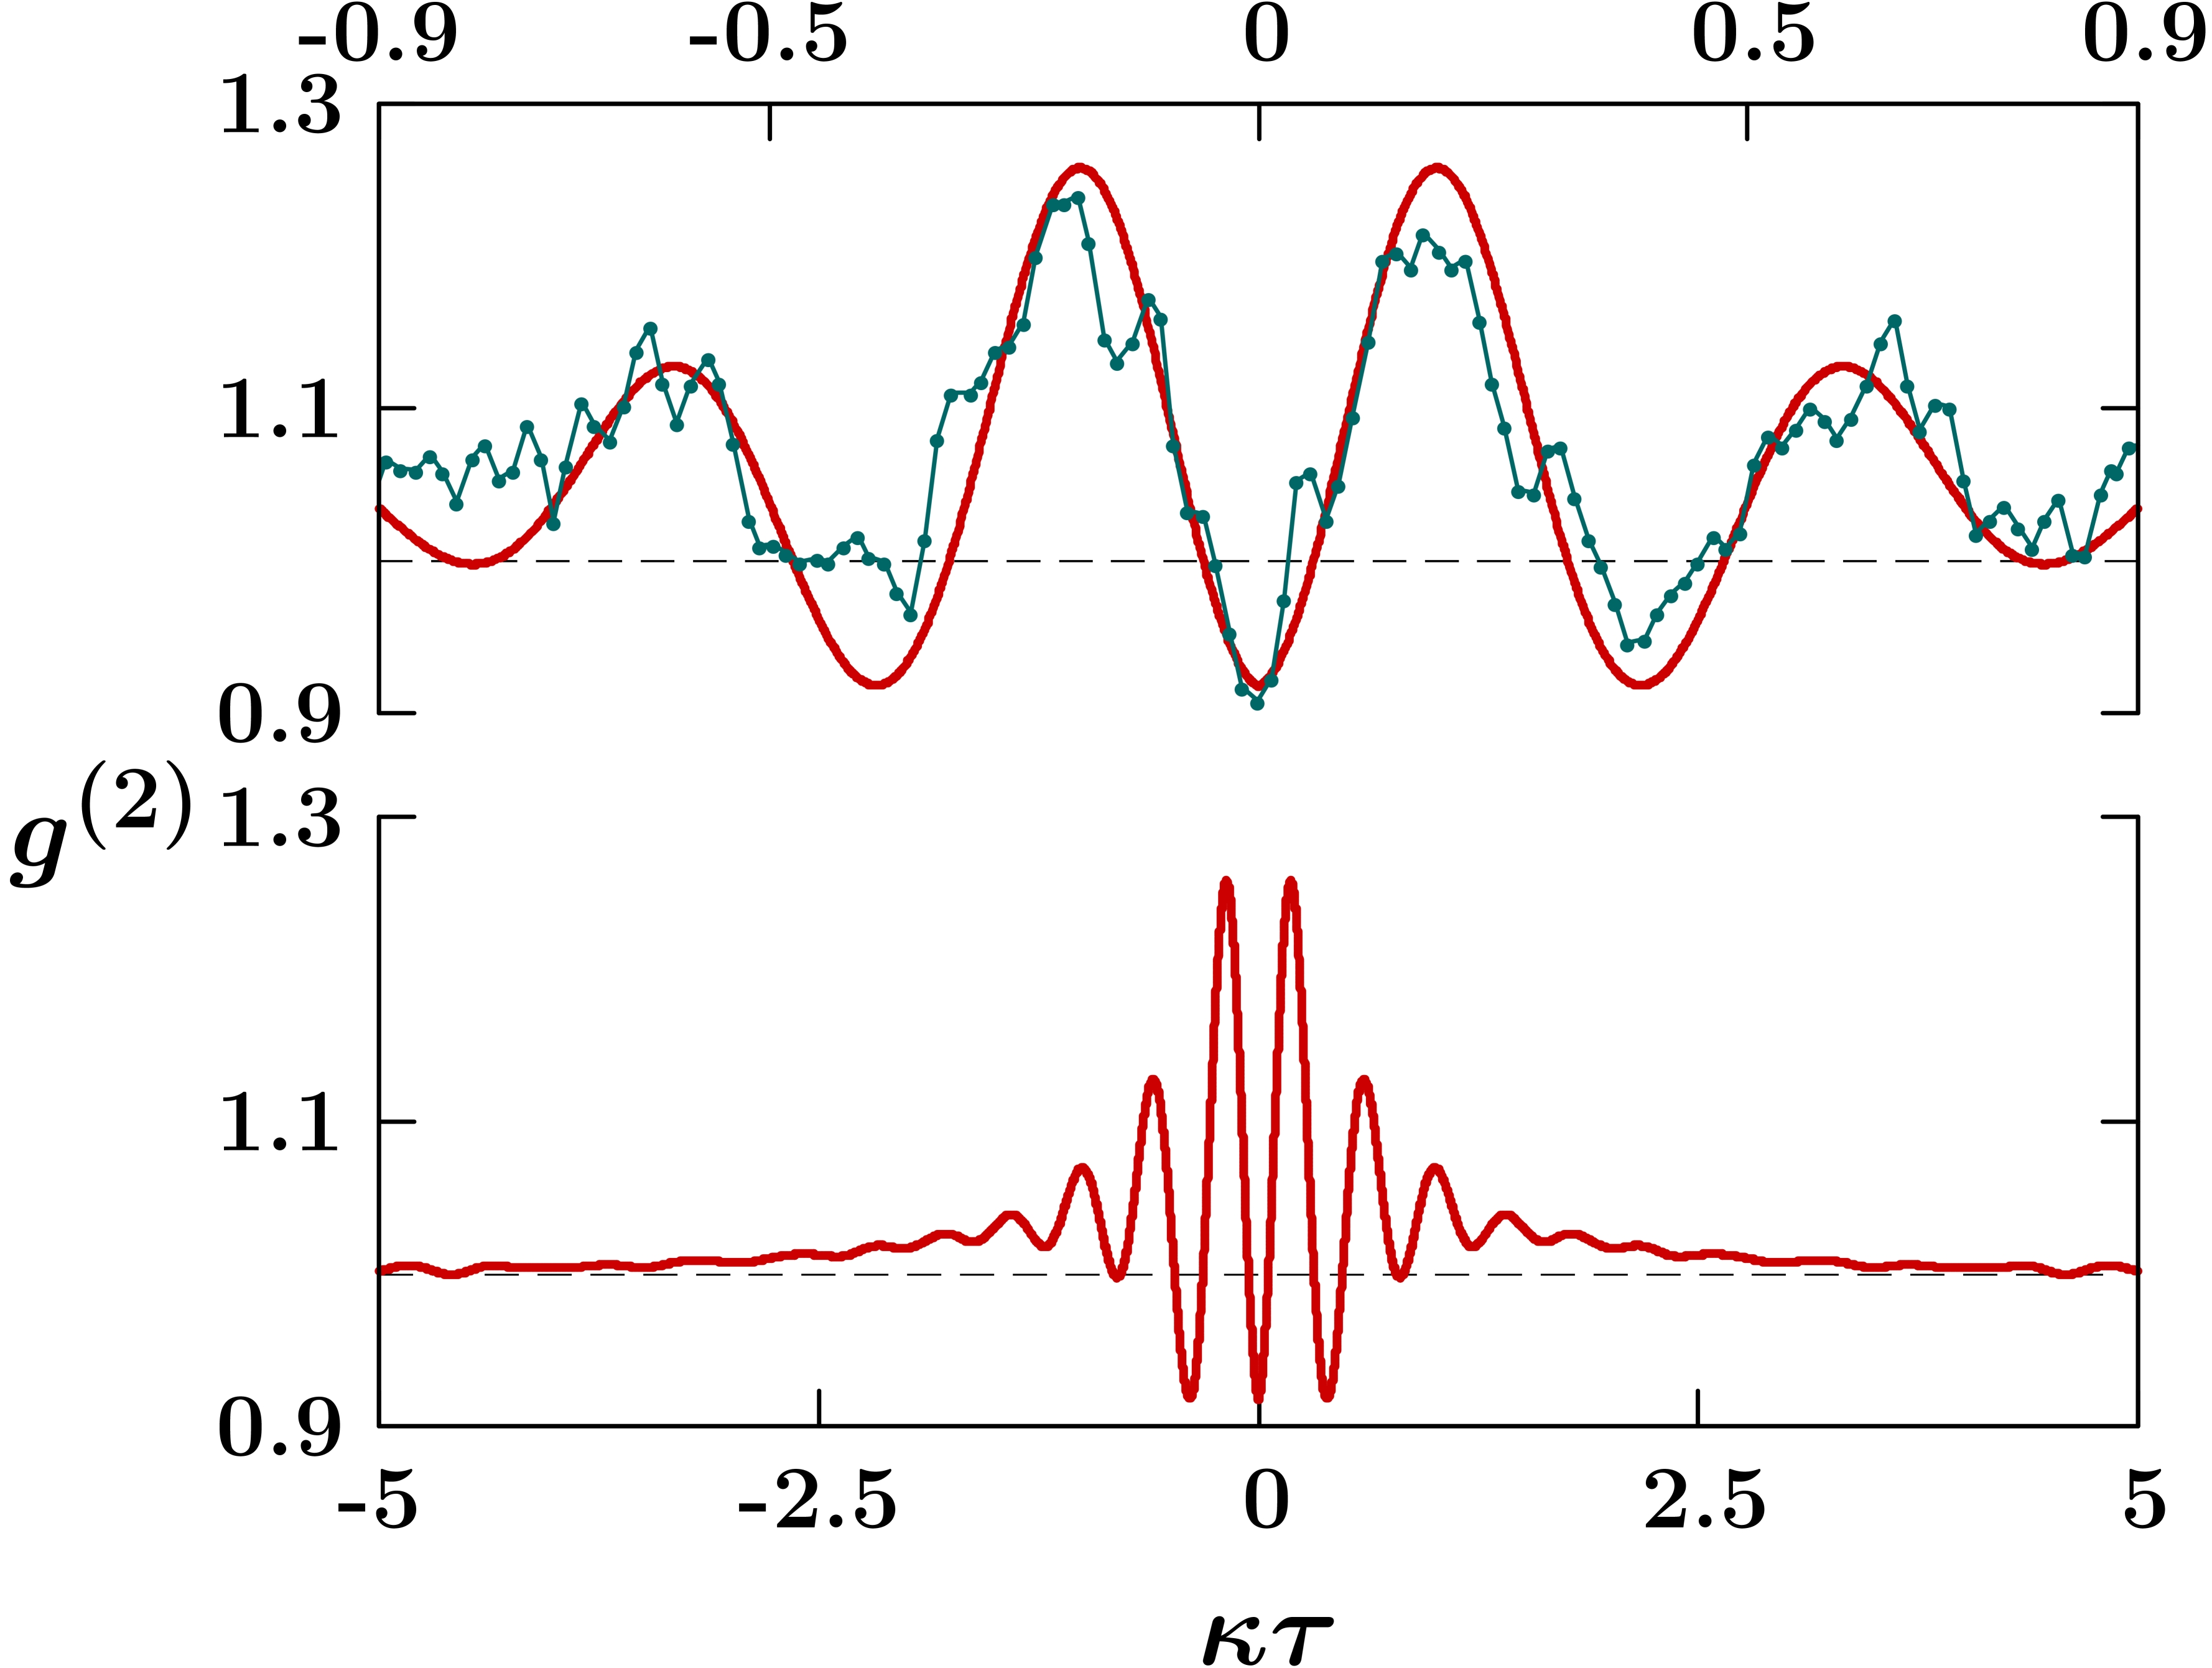
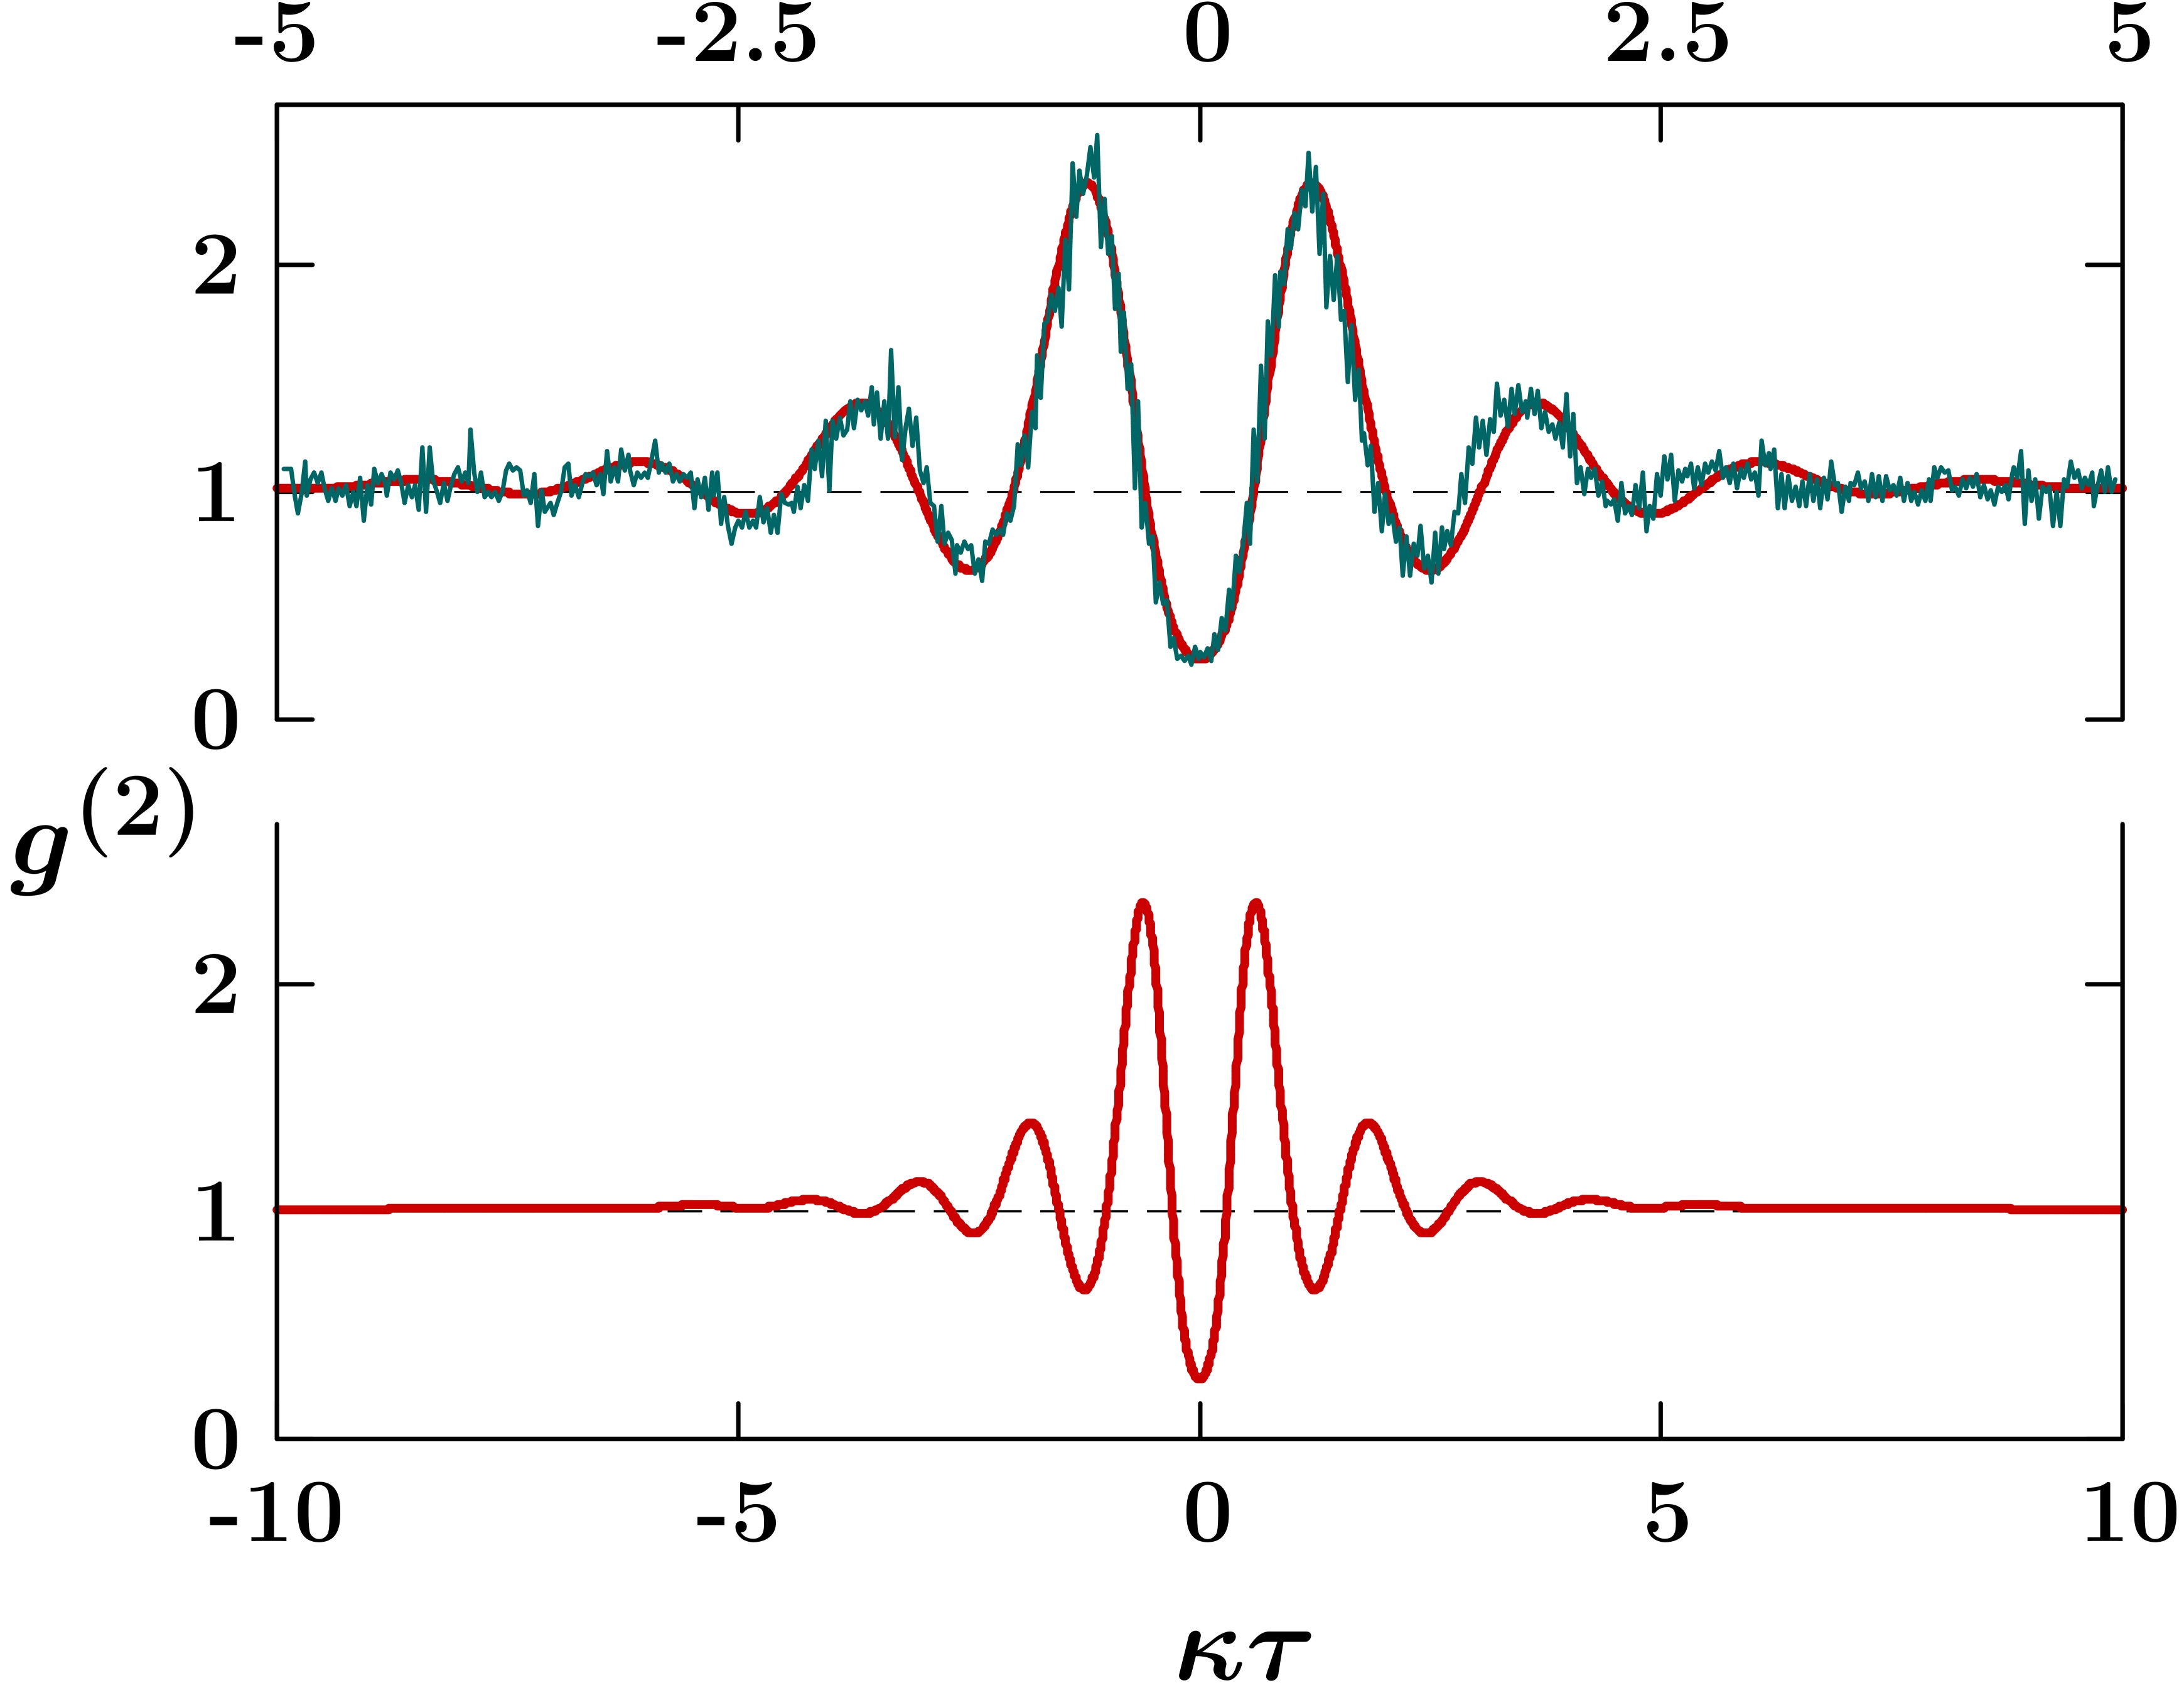
Second-order Intensity Correlations: Simulations vs Experimental Data Sets